
Assessing Apartment Investment and Management (AIV) Valuation Following Major Property Sale and Special Dividend Announcement
 Valuation Following Major Property Sale and Special Dividend Announcement")
If you’re following Apartment Investment and Management (AIV), this week delivered a big headline. The company closed the sale of four suburban Boston properties for $490 million and, in a significant move, declared a special cash dividend of $2.23 per share, which is over a quarter of its current share price. Because the payout is so substantial, the NYSE has flagged AIV shares with “due bills.” This signals to investors that the upcoming dividend changes the calculus for anyone buying or selling right now.
This high-profile dividend arrives as Apartment Investment and Management navigates a challenging run. Over the past year, shares have dipped almost 10%, and they’re down 13% year-to-date. However, momentum has shifted slightly in the past month, with returns moving into positive territory, even as longer-term performance remains underwhelming compared to peers. This latest property sale and dividend distribution represent a decisive step, but it comes on the heels of continued volatility for the stock.
Here’s the key question for investors: does this extraordinary payout create an attractive entry point, or is the market already factoring in all the good news about future growth?
Price-to-Sales of 5.3x: Is it justified?
Based on the price-to-sales (P/S) ratio, Apartment Investment and Management is valued at 5.3 times its sales. This is slightly less expensive than the North American Residential REITs industry average of 5.4x, but more expensive than its direct peer group, which trades at 4.5x. This suggests that while AIV is priced competitively against the broader industry, it carries a premium compared to similar companies.
The price-to-sales multiple is a widely used metric for evaluating real estate investment trusts. It measures how much investors are willing to pay per dollar of sales, making it a helpful benchmark when comparing companies with limited or negative earnings. For a company like AIV, which is currently unprofitable and reporting net losses, the P/S ratio provides a more stable valuation yardstick than profit-based multiples.
Although the company is not generating profits and its losses have accelerated over the last five years, investors may be paying up for perceived stability or future turnaround potential. However, with revenue declining and profitability pressure remaining, the above-average P/S ratio raises questions about whether the premium is justified by the underlying fundamentals.
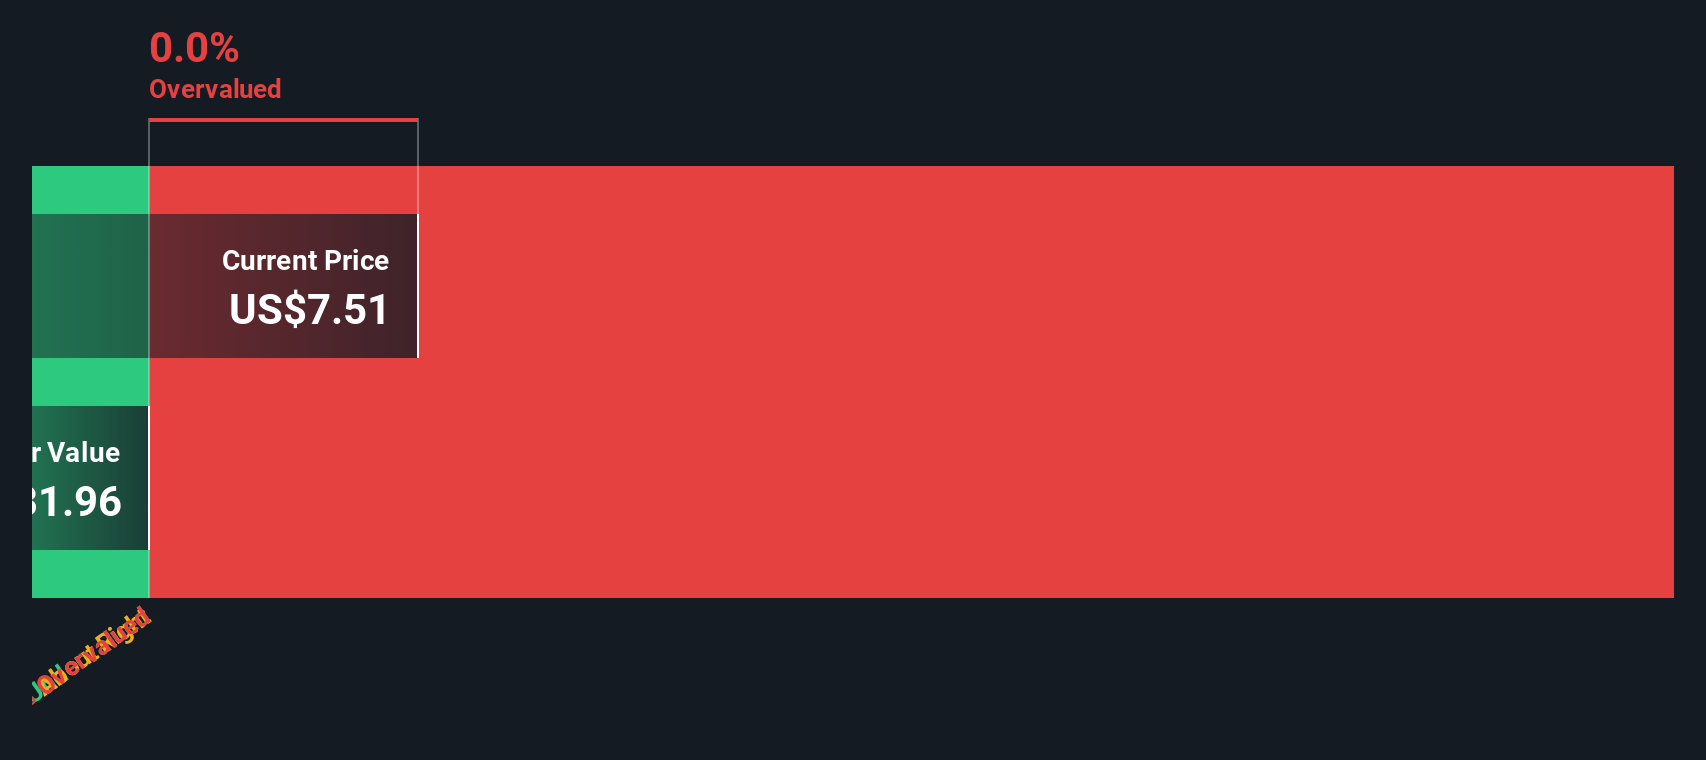
Result: Fair Value of $7.85 (ABOUT RIGHT)
See our latest analysis for Apartment Investment and Management.
However, risks remain, including ongoing net losses and a lack of clear revenue growth. These factors could challenge the sustainability of any near-term optimism.
Find out about the key risks to this Apartment Investment and Management narrative.
Another View: What Does Our DCF Model Say?
While the price-to-sales ratio points to AIV trading close to industry averages, our DCF model offers a different perspective. This approach weighs future cash flows rather than current sales and delivers a conflicting picture. Which view should long-term investors trust?
Look into how the SWS DCF model arrives at its fair value.
Stay updated when valuation signals shift by adding Apartment Investment and Management to your watchlist or portfolio. Alternatively, explore our screener to discover other companies that fit your criteria.
Build Your Own Apartment Investment and Management Narrative
If you see the story differently or want to run your own numbers, you can build a personalized perspective in just a few minutes. Do it your way.
A great starting point for your Apartment Investment and Management research is our analysis highlighting 3 important warning signs that could impact your investment decision.
Looking for more investment ideas?
Don’t let opportunity pass you by. The market often rewards those who look beyond the obvious and seize what others overlook. Here are three standout ways to get ahead using Simply Wall Street’s powerful screener tools:
This article by Simply Wall St is general in nature. We provide commentary based on historical data
and analyst forecasts only using an unbiased methodology and our articles are not intended to be financial advice. It does not constitute a recommendation to buy or sell any stock, and does not take account of your objectives, or your
financial situation. We aim to bring you long-term focused analysis driven by fundamental data.
Note that our analysis may not factor in the latest price-sensitive company announcements or qualitative material.
Simply Wall St has no position in any stocks mentioned.
New: Manage All Your Stock Portfolios in One Place
We’ve created the ultimate portfolio companion for stock investors, and it’s free.
• Connect an unlimited number of Portfolios and see your total in one currency
• Be alerted to new Warning Signs or Risks via email or mobile
• Track the Fair Value of your stocks
Try a Demo Portfolio for Free
Have feedback on this article? Concerned about the content? Get in touch with us directly. Alternatively, email [email protected]
link


